Illinois maps: printable and free
5 free maps of Illinois: high-resolution PNG (300 dpi) and PDF for US Letter or A4.
PDF = US Letter; A4 for other countries. Tap a map to view it full size. Free for personal, school and commercial use.
Data updated · By Ankit Kumar, compiled from public U.S. government and open datasets · How these numbers are made
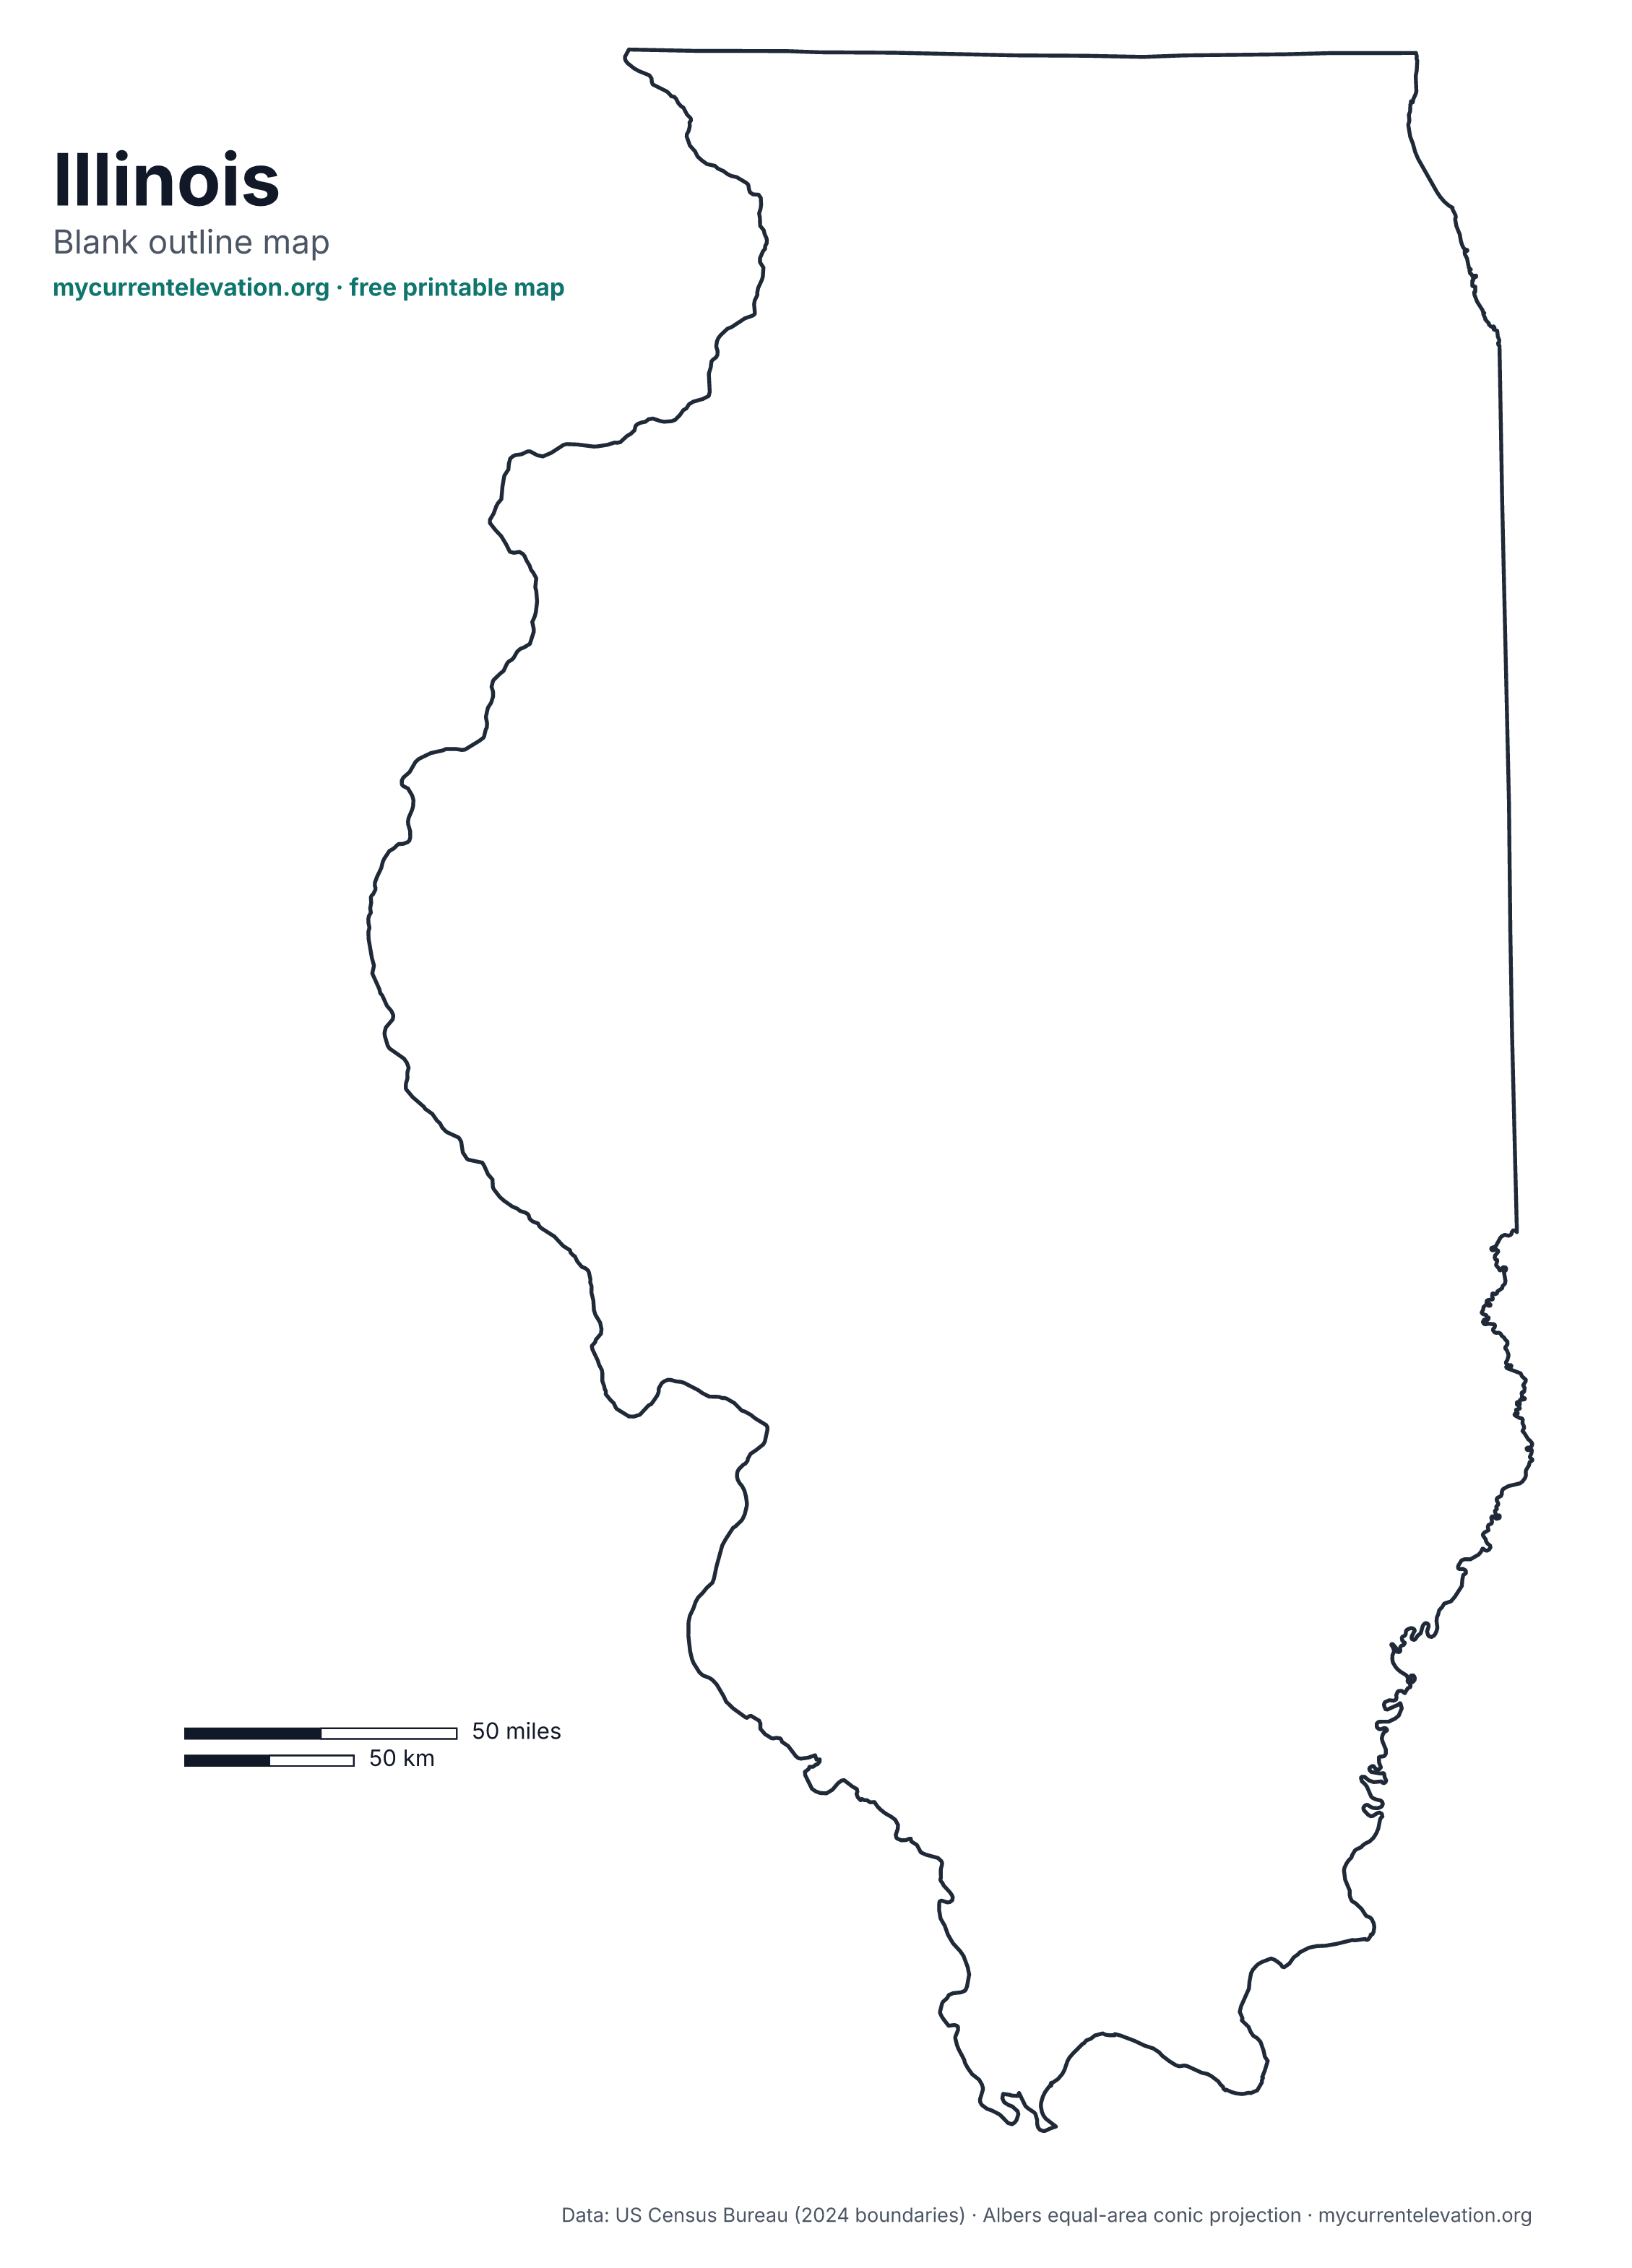
1. Illinois blank outline map
The state border only, with a scale bar. Good for labeling, coloring and tracing.
 View full size
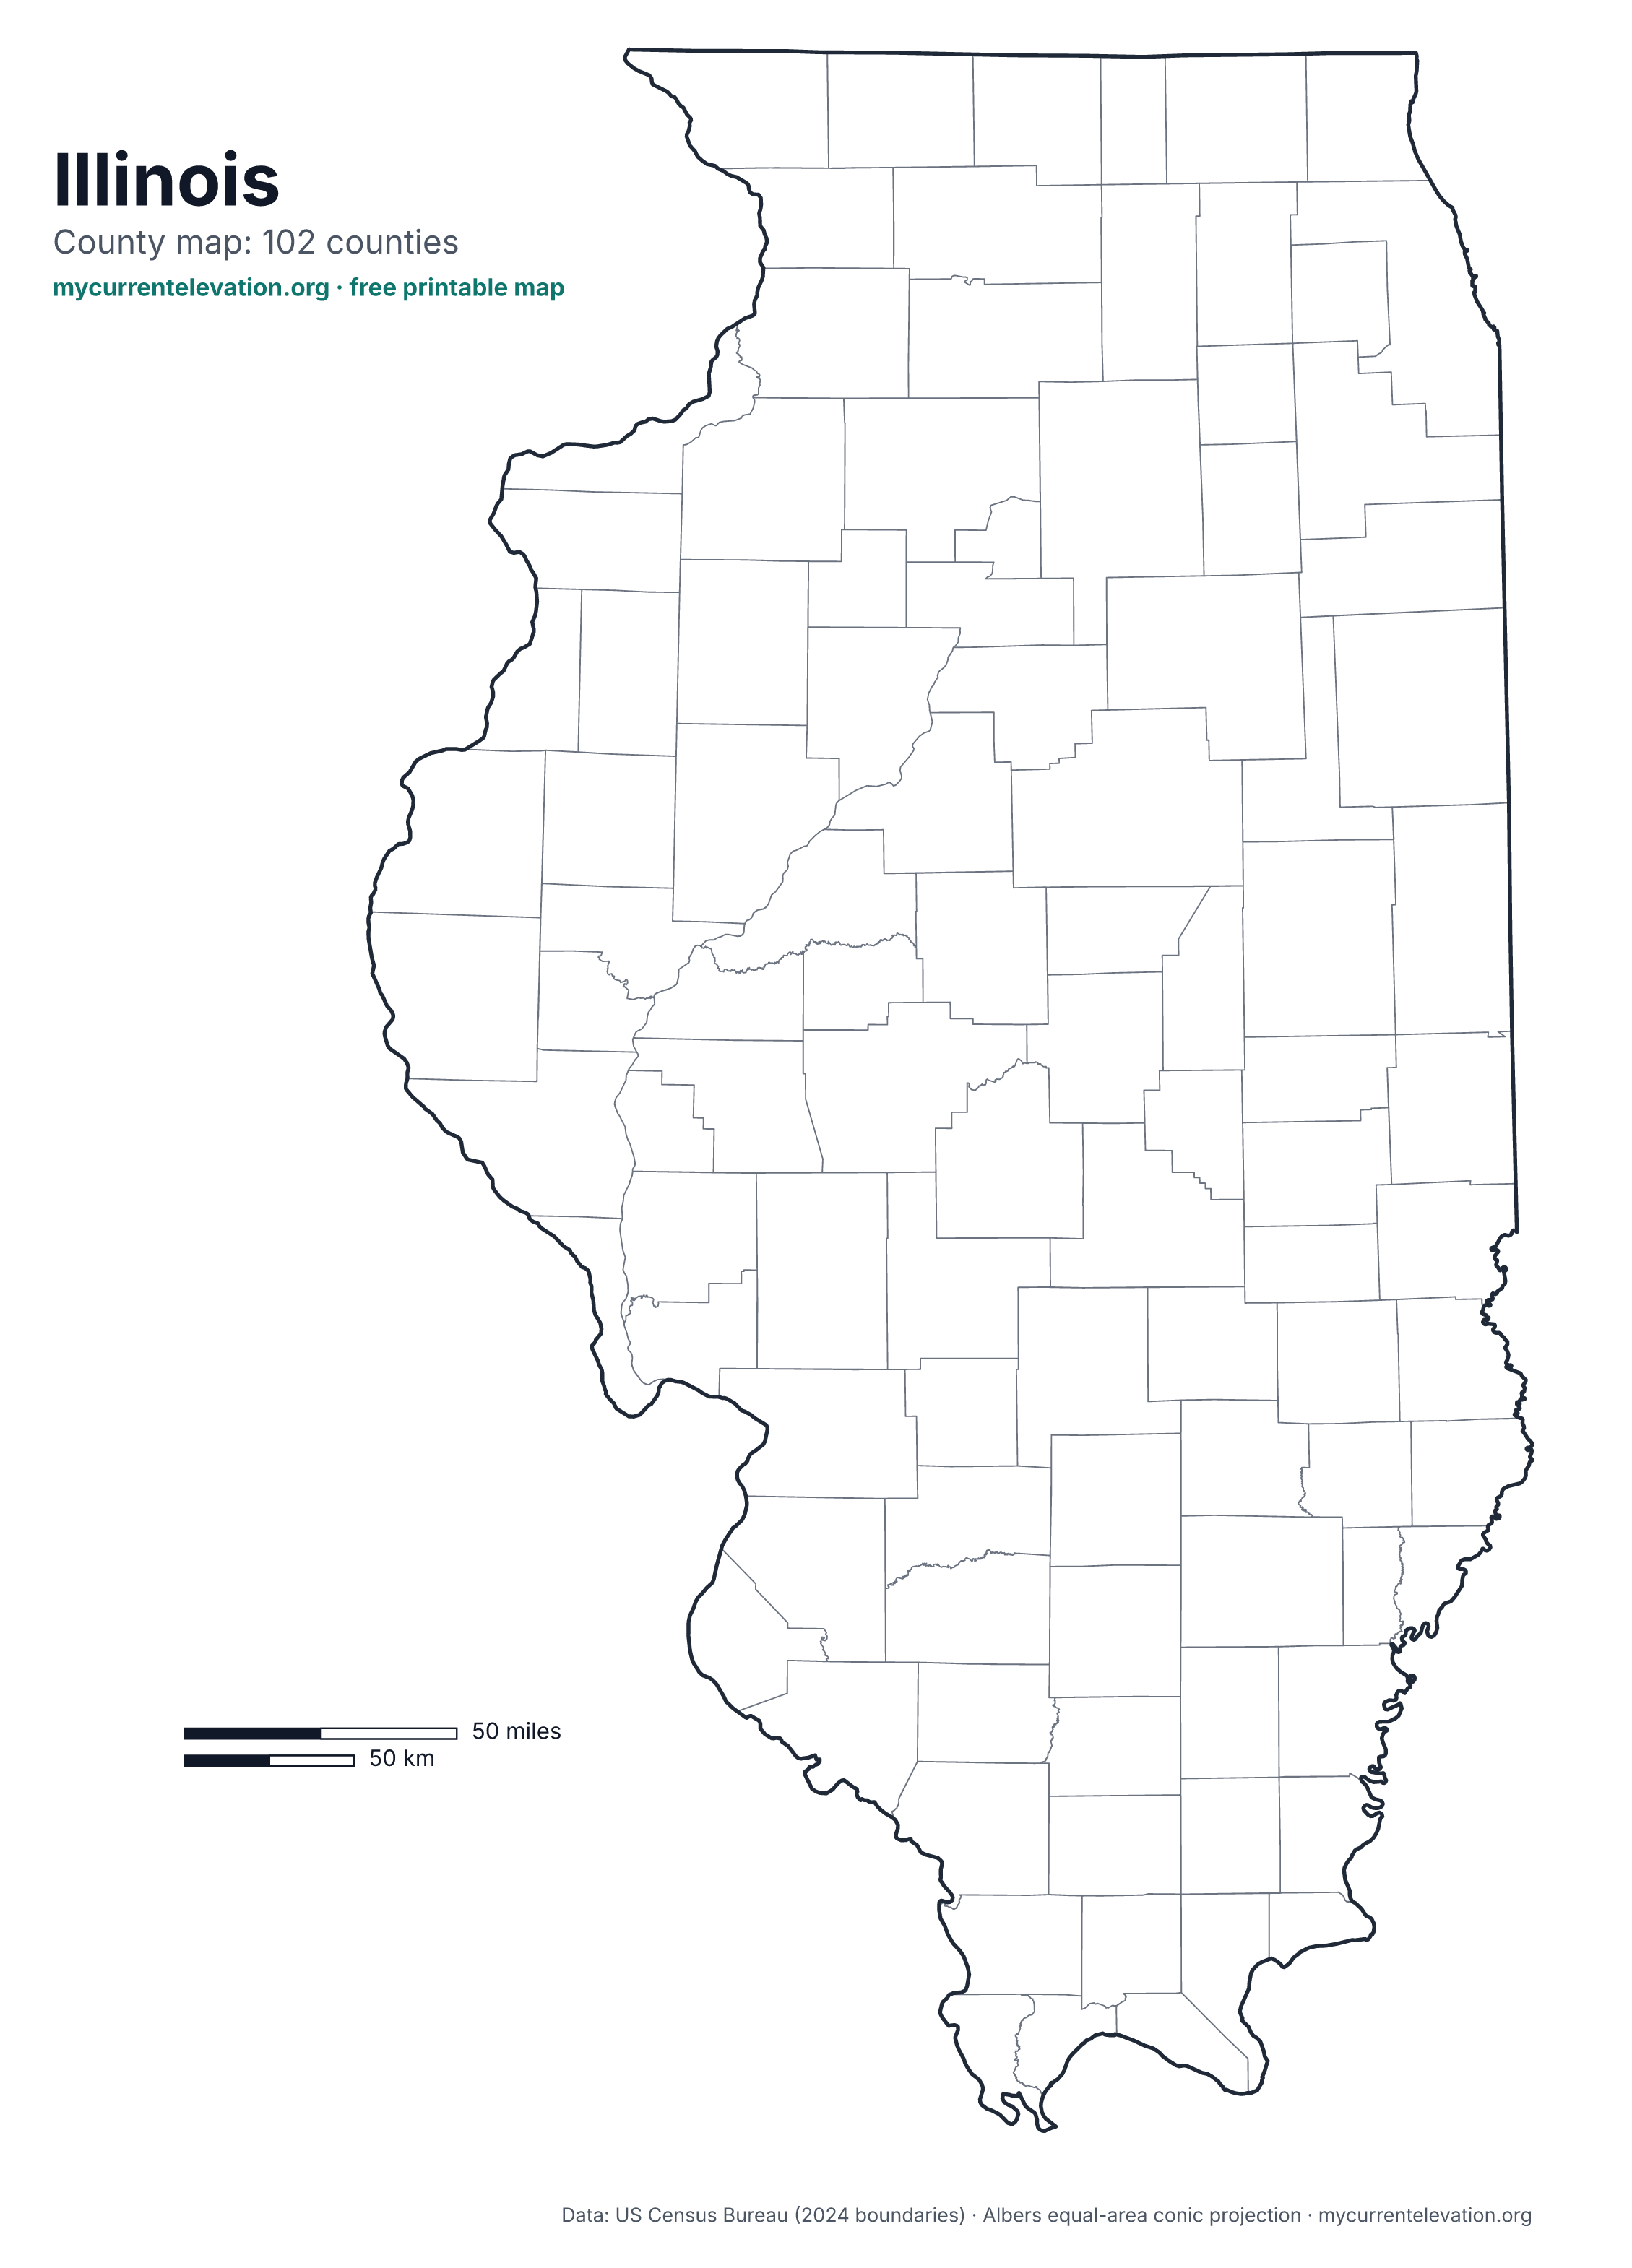
2. Illinois county map
All 102 counties, outlined without names.
 View full size
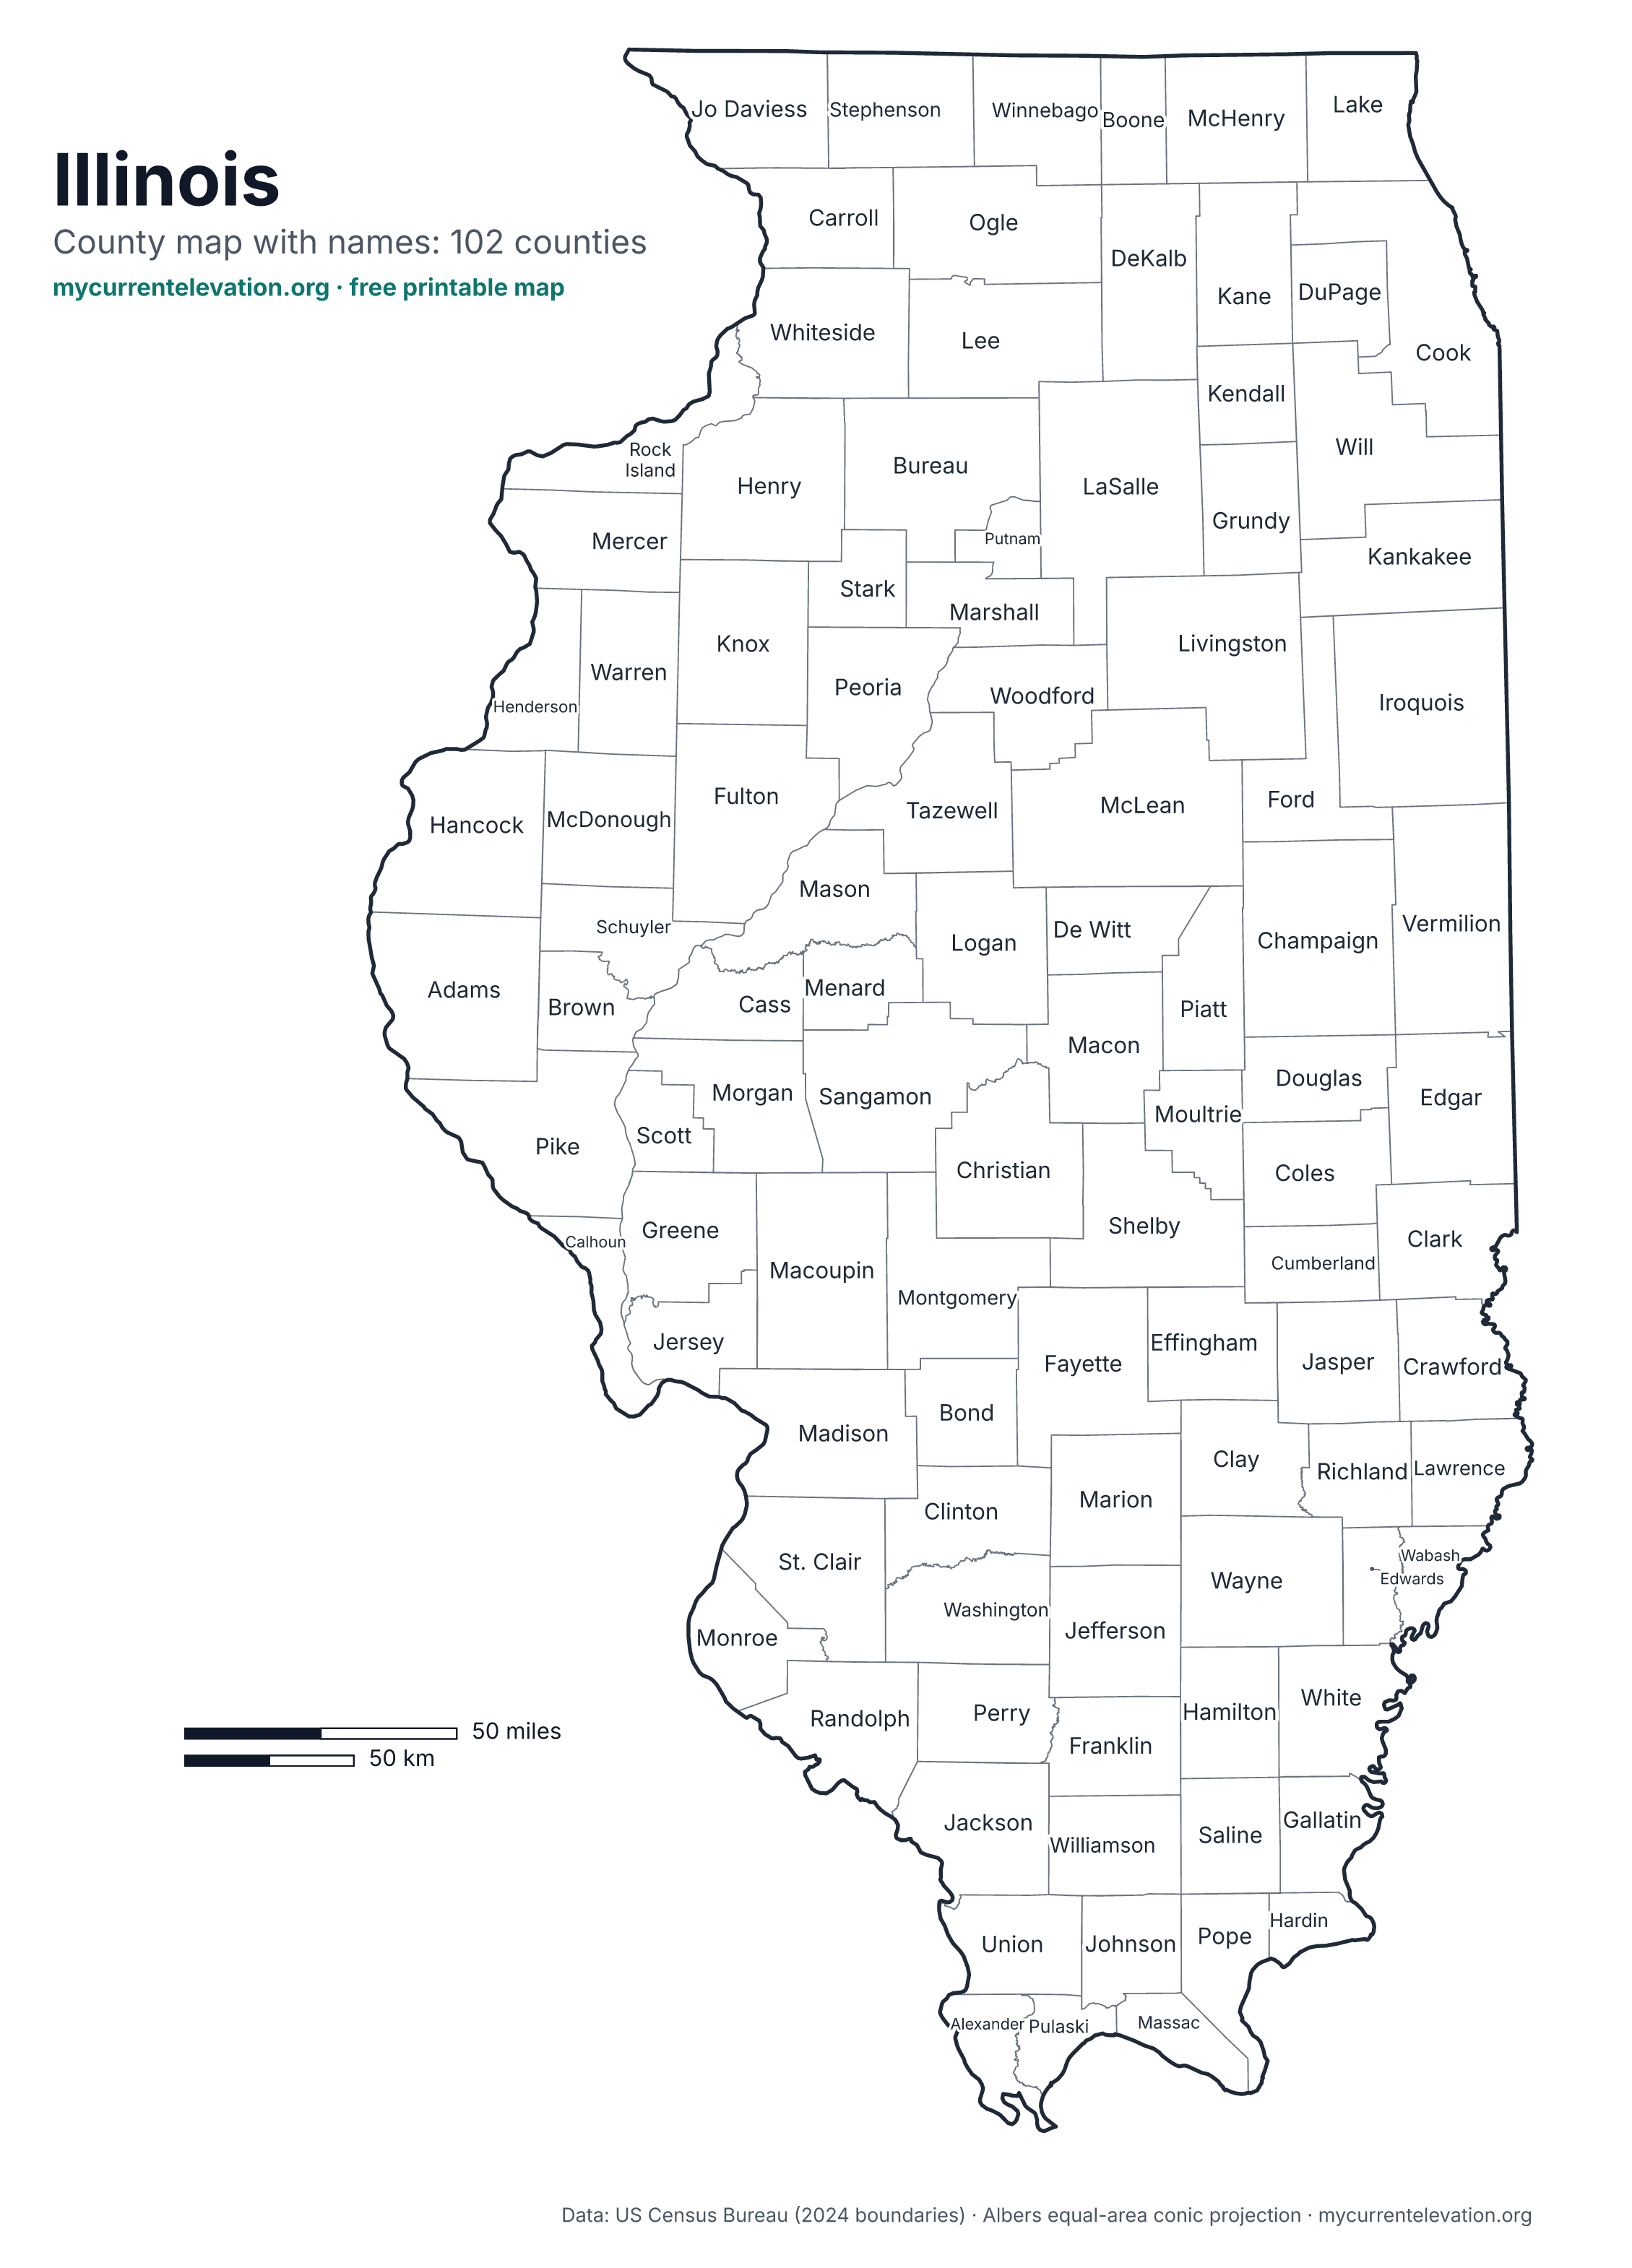
3. Illinois labeled county map
The same 102 counties, each named. Names that don't fit inside a small area sit just outside, joined by a short line.
 View full size
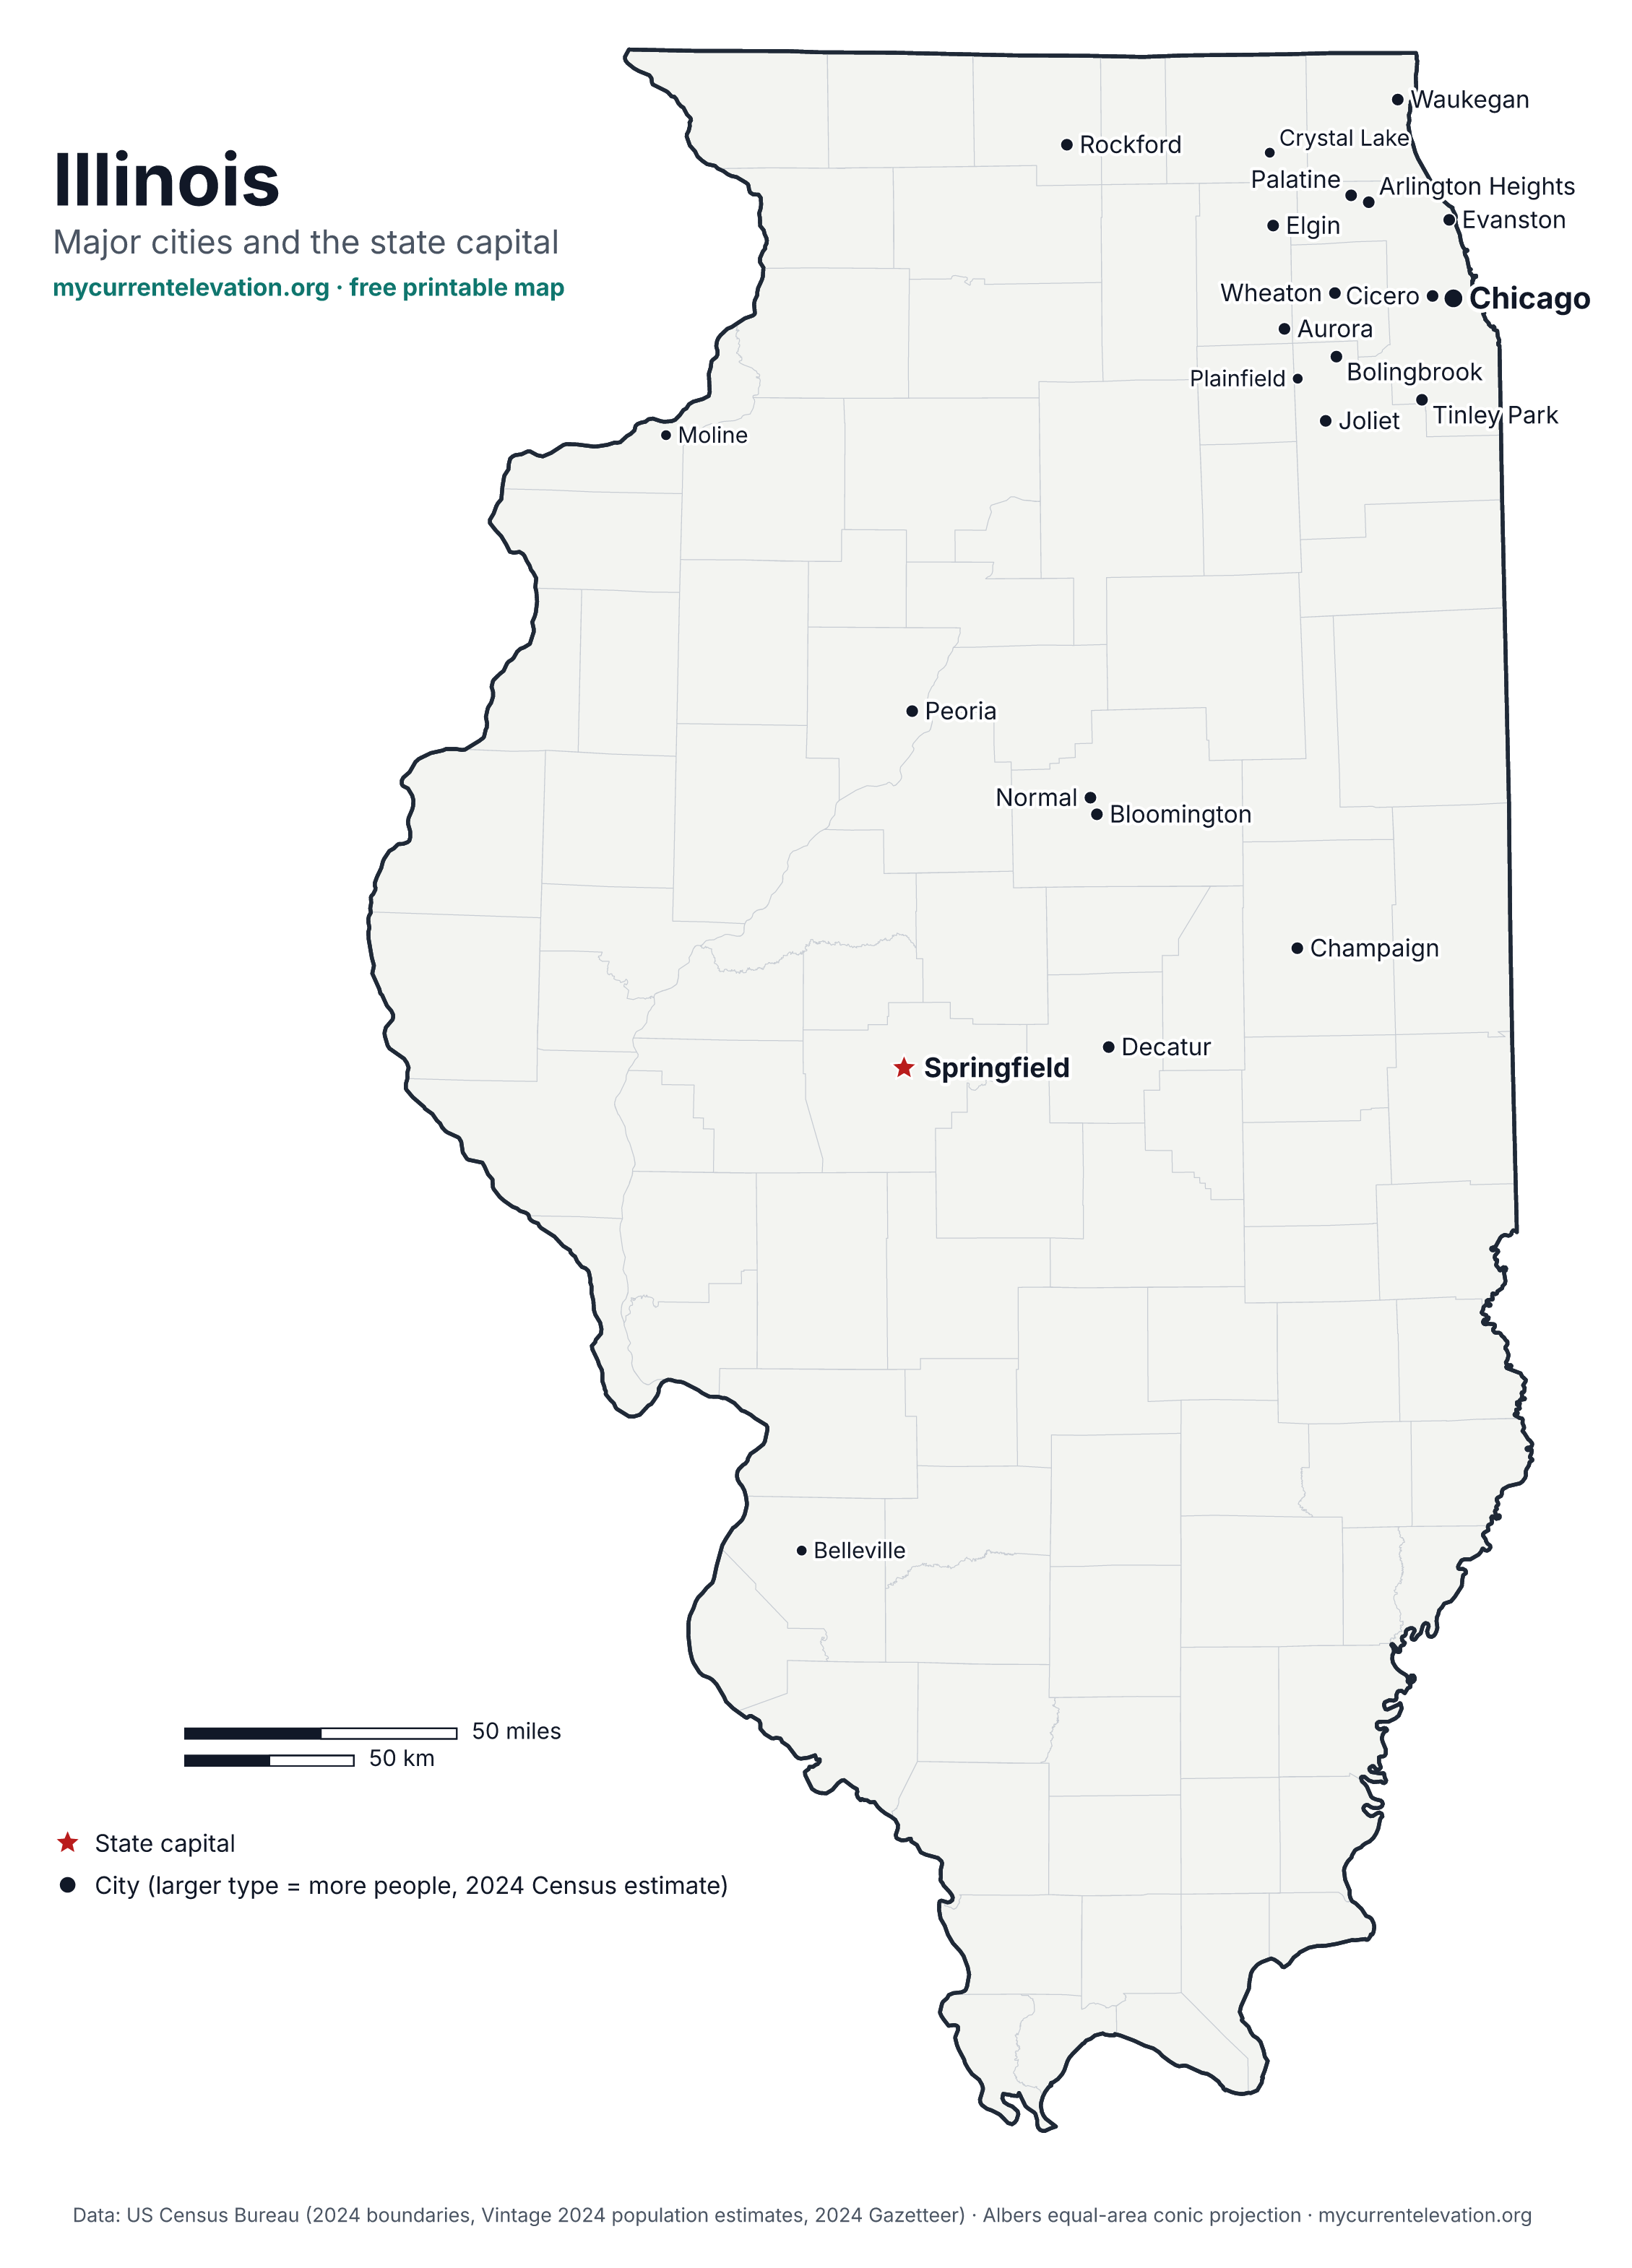
4. Illinois map with major cities
23 cities, chosen by 2024 Census population and spaced so no labels overlap. The capital is marked with a star.
 View full size
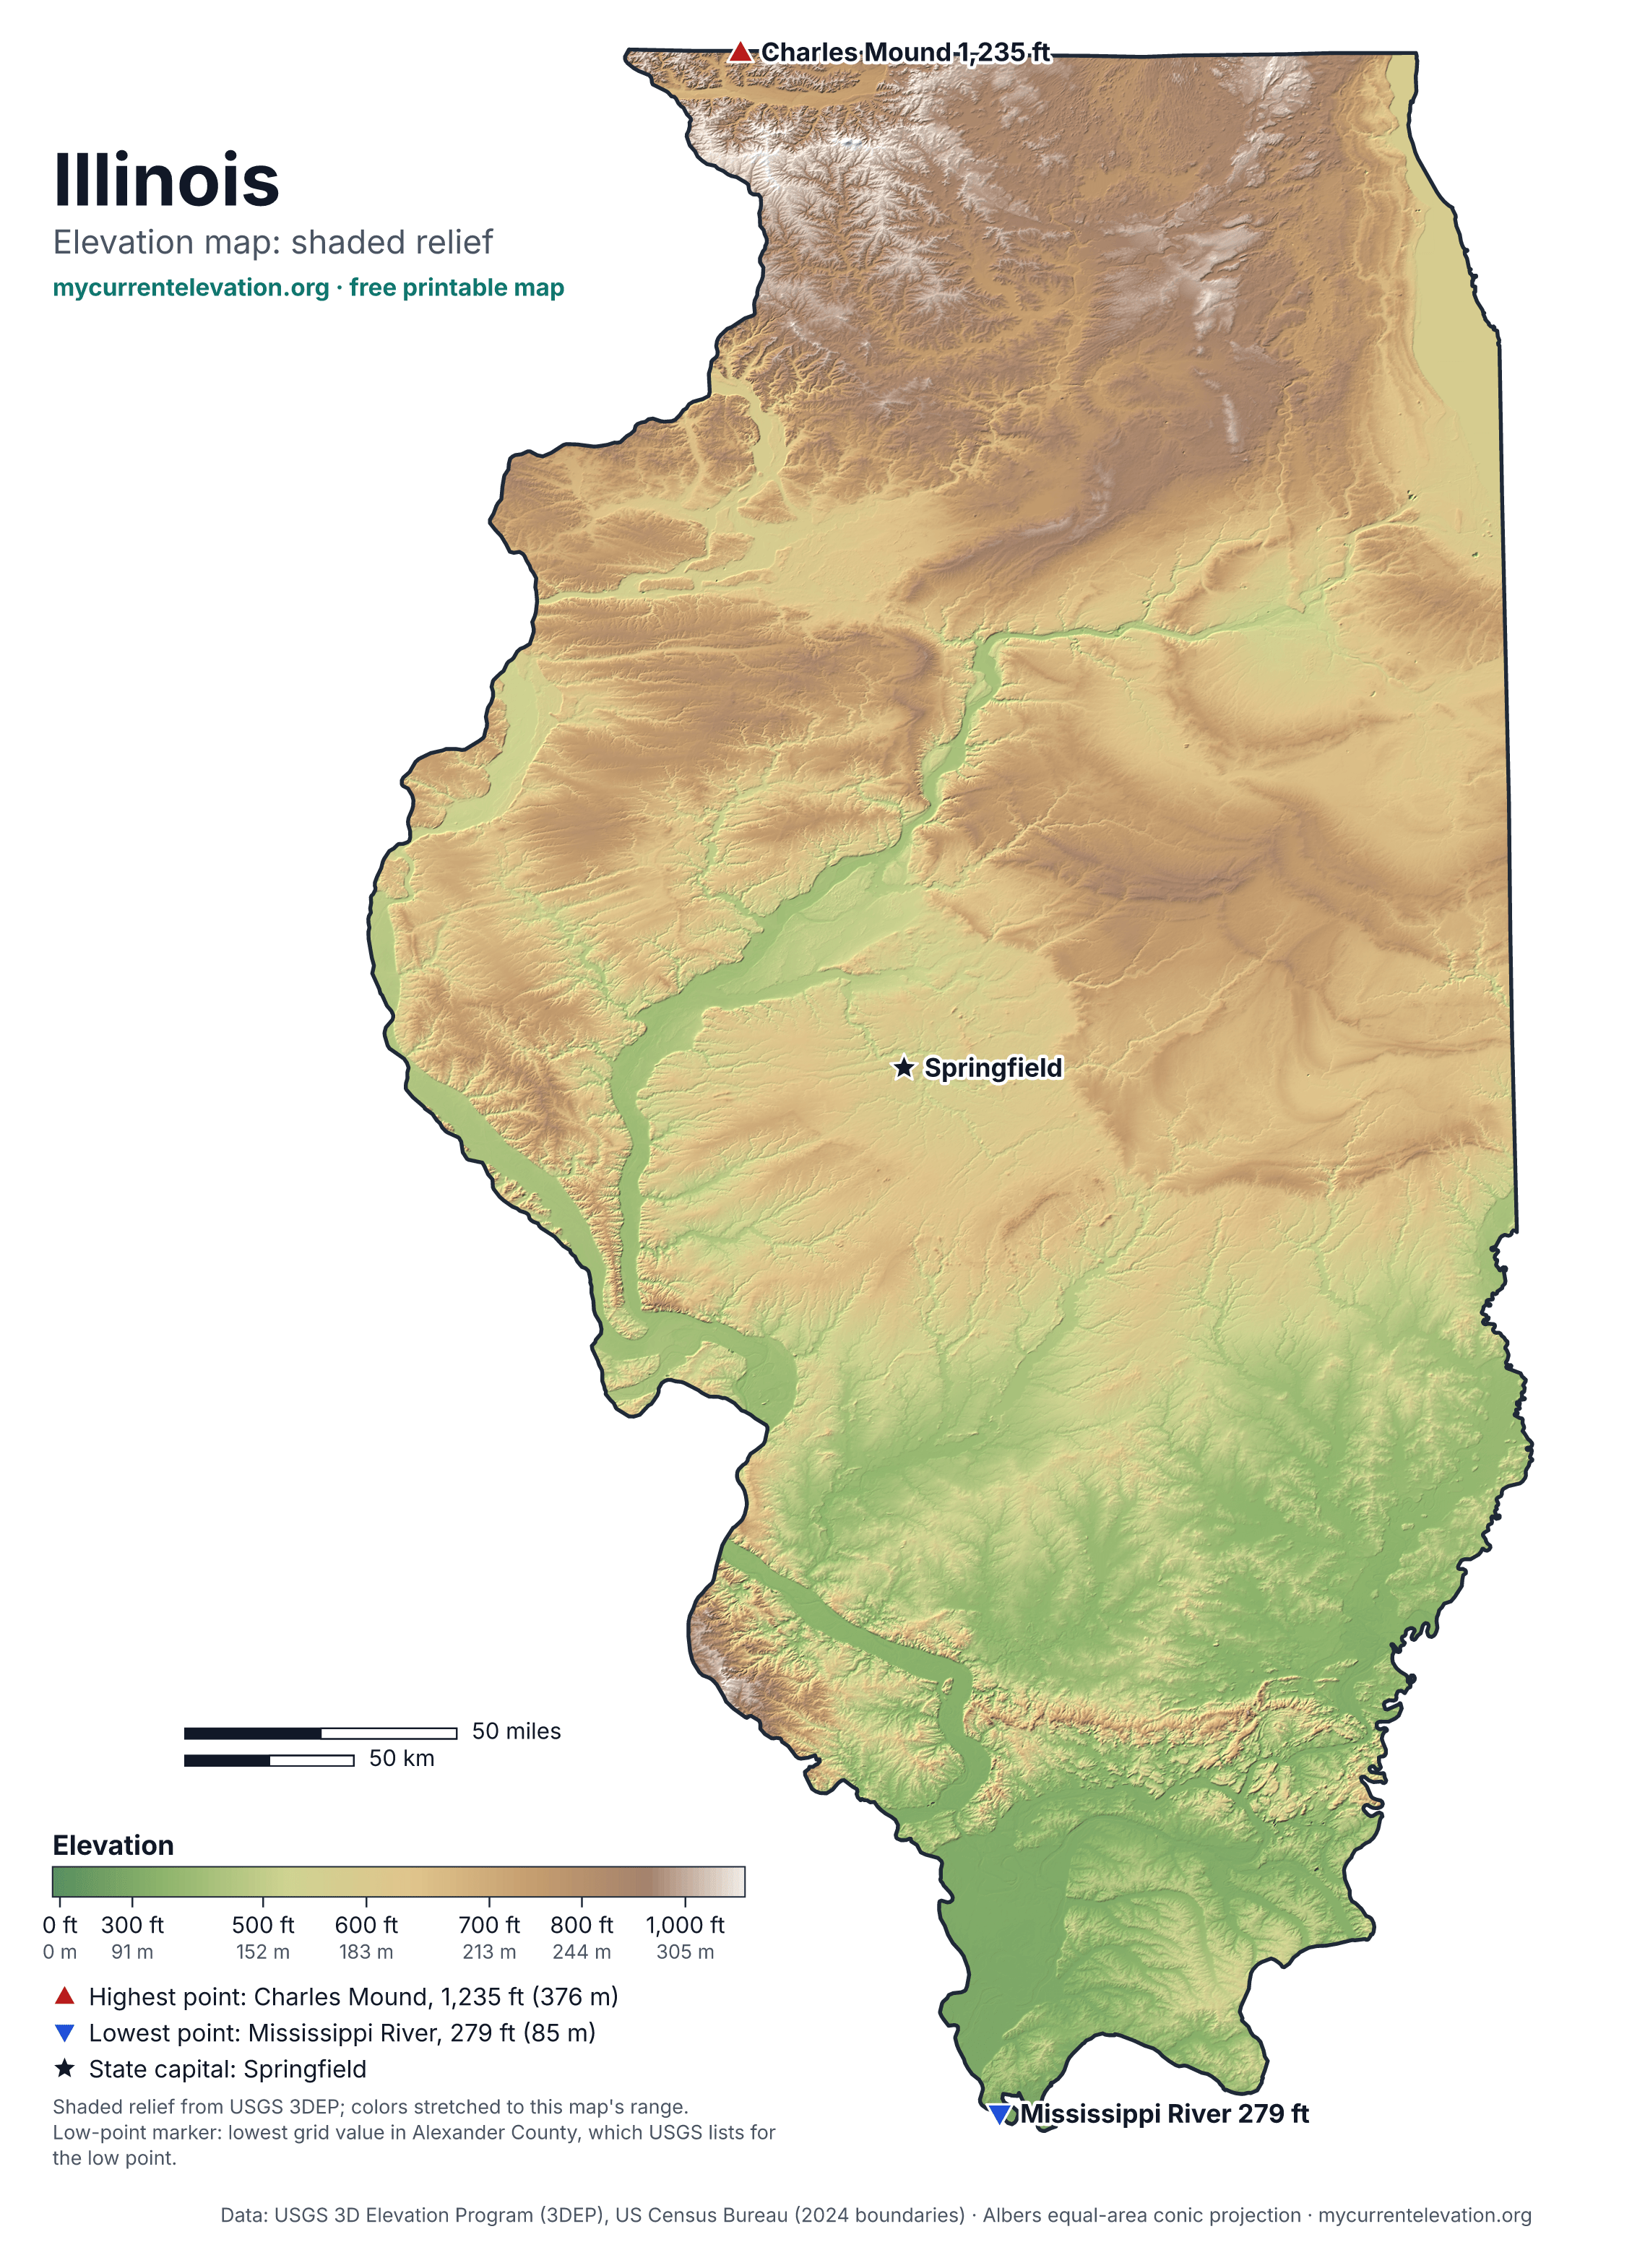
5. Illinois elevation map
USGS 3DEP elevation as color plus hillshade. Legend in feet with meters underneath; triangles mark the high and low points, a star the capital.
 View full size
Illinois: shape, counties and terrain
Illinois spans about 213 miles from east to west and 383 miles from north to south, with 55,513 square miles of land. Its outline is irregular: the state fills only 69% of the box drawn around it on the map. The boundary is a single piece of land with no islands.
Illinois has 102 counties. The largest by land area is McLean County (1,183 sq mi) and the smallest is Putnam County (160 sq mi). The capital, Springfield, sits at 600 ft downtown (USGS).
Elevation runs from 279 ft (85 m) on the Mississippi River to 1,235 ft (376 m) at Charles Mound in Jo Daviess County, a range of 956 ft. The sampled average is about 628 ft.
On the relief map's elevation grid, under 1% of the state lies below 0 ft, 23% between 0 and 500 ft and 75% between 500 and 1,000 ft and 2% above 1,000 ft. Split from south to north into thirds, the southern third averages 449 ft, the central third 617 ft and the northern third 768 ft, so the land is highest in the northern third and lowest in the southern third.
More figures, with sources: Illinois elevation: highest, lowest and average points.
How teachers and students can use these maps
- Blank map: label Springfield, the capital, and the largest cities, then check them against the cities map. Older students can draw in rivers or mountain ranges from an atlas.
- County map: find your own county among the 102. The labeled version works as an answer key; the blank one as a quiz.
- Cities map: Springfield to Waukegan is about 200 miles in a straight line. Measure it with the scale bar and see how close you get.
- Elevation map: find Charles Mound (1,235 ft) and the Mississippi River (279 ft), and work out the difference: 956 ft. Then use the legend to estimate the elevation of your town and check it with our elevation tool.
- Printing: each map has a US Letter PDF and an A4 PDF. The PDFs are vector files, so lines and labels stay sharp at any size. The outline maps use very little ink in black and white.
License: free to use
These maps are free for personal, school and commercial use. Print them, copy them, change them, and use them in worksheets, slides, books, apps or websites. No permission or fee is needed. A credit is appreciated: Map: MyCurrentElevation.org.
The data behind them (US Census Bureau boundaries and population, USGS elevation) is in the public domain. Inter, the typeface on the maps, is licensed under the SIL Open Font License.
Sources
- U.S. Census Bureau, 2024 Cartographic Boundary Files (states, counties; 1:500,000) — state and county borders, county land areas, map extents
- USGS 3D Elevation Program (3DEP) elevation service — elevation colors and shading on the relief map, and the elevation shares quoted above
- U.S. Census Bureau, Vintage 2024 Population Estimates (cities and towns) — which cities are largest
- U.S. Census Bureau, 2024 Gazetteer Files (place locations) — city locations
- USGS, Elevations and Distances in the United States (highest and lowest elevations) — Charles Mound elevation (highest point)
- USGS, Elevations and Distances in the United States (highest and lowest elevations) — lowest point
- USGS 3DEP via the Elevation Point Query Service — sampled average elevation and the capital's downtown elevation
- U.S. Census Bureau TIGERweb, Counties layer — number and type of county-level areas
How each number is produced: methodology and data sources.
Other states and the US map: all printable maps · Illinois elevation
Data updated · By Ankit Kumar, compiled from public U.S. government and open datasets · How these numbers are made